“My store converts at 1.5%.” The number is useful, but it tells you nothing about why. Do visitors fail to find products? Find them but aren’t convinced? Add them to the cart and abandon when they see shipping? Each of these has a completely different fix — and fixing the wrong stage means effort and budget for nothing.
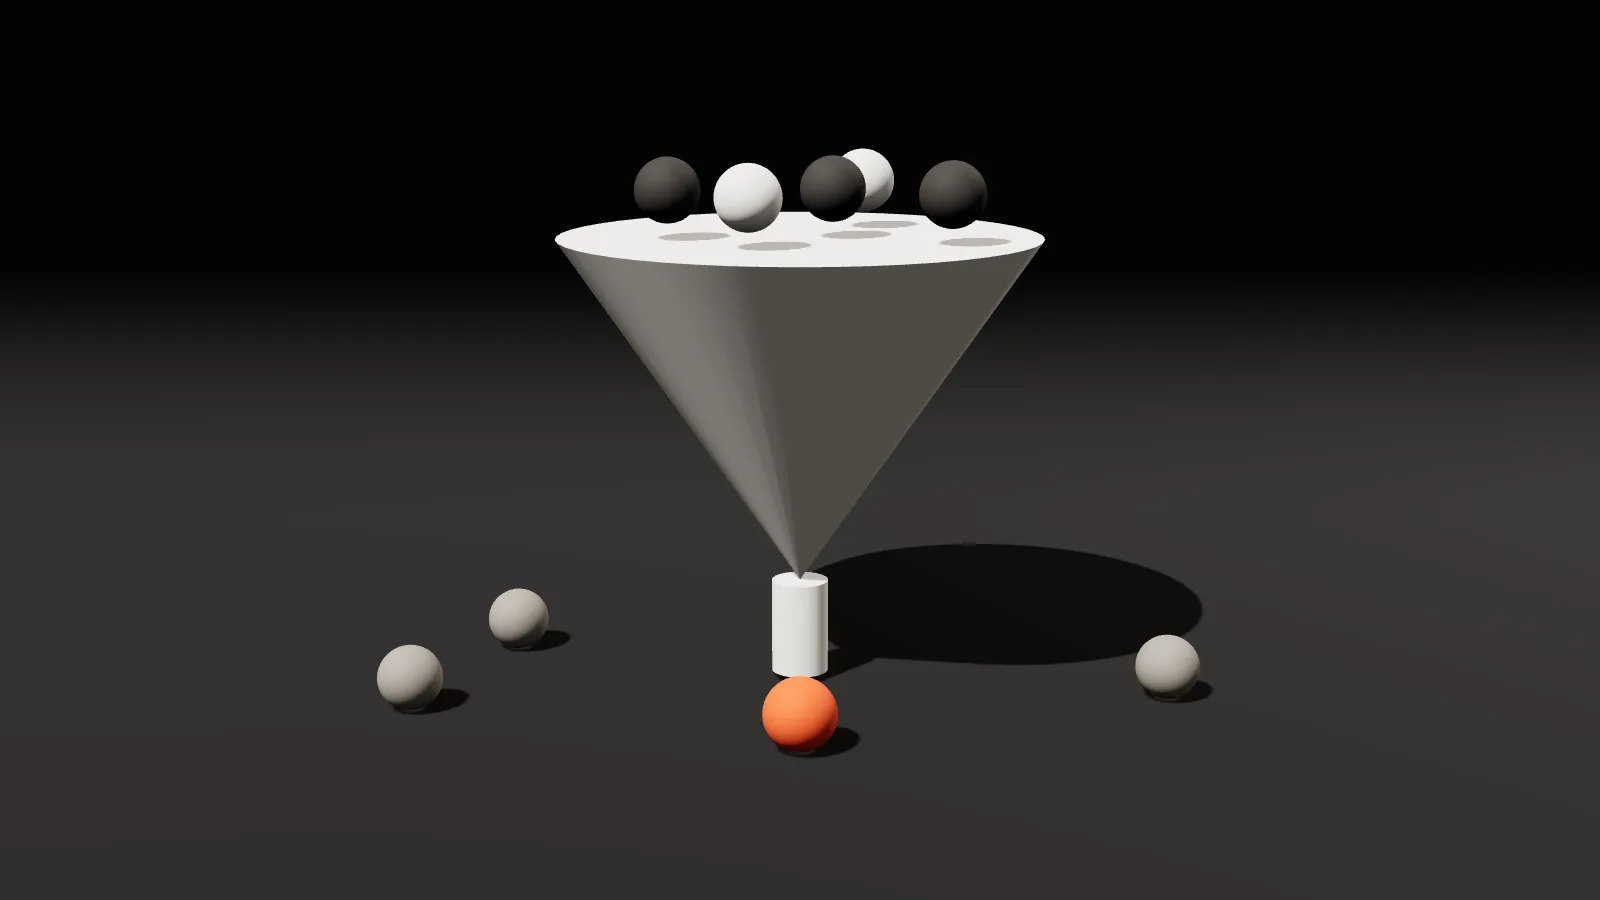
The conversion funnel breaks that single number into stages, so you see exactly where customers leak out. This guide explains how to build the funnel, how to read it, what to do at each stage, and why you usually start with the weakest link.
The stages of an online store funnel
A typical store funnel has five stages, and each rate is calculated from the stage before it:
- Sessions: the number of visits to the store in the period.
- Product view: the share of sessions that reached at least one product page.
- Add to cart: the share of product viewers who added to cart.
- Begin checkout: the share of cart adders who started checkout.
- Purchase: the share of checkout starters who completed the order.
Overall conversion rate is the product of these rates. Example: 60% × 10% × 50% × 60% = 1.8% — so every 20,000 sessions yield 360 orders.
An example: where do customers drop off?
| Stage | Count | Progression rate | Drop-off |
|---|---|---|---|
| Sessions | 20,000 | — | — |
| Product view | 12,000 | 60% | 40% |
| Add to cart | 1,200 | 10% | 90% |
| Begin checkout | 600 | 50% | 50% |
| Purchase | 360 | 60% | 40% |
The figures are illustrative, but they reveal an important pattern: the biggest leak here is between product view and add to cart. Nine in ten people see the product and leave.
Why start with the weakest stage?
Because the funnel multiplies, raising any stage by a given percentage raises orders by the same percentage. More importantly: one percentage point on a low-rate stage is a far bigger relative increase.
- Raising add-to-cart from 10% to 11% = a 10% increase in orders = 36 extra orders.
- Raising product view from 60% to 61% = a 1.7% increase = 6 orders.
- Raising purchase from 60% to 61% = 6 orders as well.
For the same one-point improvement, the weakest stage delivered six times the result. That’s what our conversion funnel calculator works out: it draws your funnel, shows the effect of improving each stage by the number of points you choose, and sets your priority.
A percentage point isn’t the same effort at every stage. Raising purchase from 60% to 61% may be easier (adding a payment method, say) than raising add-to-cart from 10% to 11%. Use the calculation to rank opportunities, then weigh it against the cost of each improvement.
Stage one: from visit to product view
If this rate is low, visitors arrive but don’t find their way to products. Common causes:
- Ads sending people to the home page instead of the advertised product or category.
- Mismatched traffic from an audience that isn’t interested in your products at all.
- A cluttered or slow home page with no clear path to the most popular categories.
- Weak on-site search that doesn’t understand the different Arabic words for the same product.
Point every ad at the page closest to its promise, and review traffic sources with UTM links to see which channel brings visitors who don’t browse.
Stage two: from product view to cart
Here the customer decides: is this product right for me, at this price? Reasons for drop-off:
- Few or unclear photos, and no video or real-life shots.
- Missing information: sizes, material, dimensions, compatibility.
- A price without justification compared with alternatives, or no offers and bundles.
- A lack of trust: no genuine reviews, no shipping and returns information near the buy button.
- An unclear add-to-cart button, or one far away on mobile.
Put a shipping and returns summary right next to the button — “Delivery in 2–4 days · Free exchanges for 14 days” — and read how to write a trust-building policy in our return policy guide.
Stage three: from cart to checkout
Abandoned carts are normal in every store; some people use the cart as a wishlist. But very high abandonment has fixable causes:
- Shipping costs revealed late, surprising the customer.
- Forced registration before checkout.
- A prominent discount-code field that sends customers off to hunt for a code and never come back.
- No free-shipping threshold, or no indication of how much more is needed to reach it.
Show shipping costs early, allow guest checkout, and use abandoned-cart recovery messages if your platform supports them.
Stage four: from checkout to purchase
- Missing payment methods: mada, Apple Pay, instalments and cash on delivery, depending on your audience.
- Too many steps or long forms asking for unnecessary information.
- Technical errors: declined cards, a page that fails in a certain browser, an address field that rejects Arabic.
- Surprise fees at the final step.
Make a test purchase from your own phone regularly, with every payment method — some problems only show up when you actually try.
How to get your funnel numbers
If e-commerce events are set up in Google Analytics 4 (view item, add to cart, begin checkout, purchase), you can build a purchase-journey report directly. Many store platforms show a similar report in their analytics dashboard. What matters:
- Use the same base (sessions or users) at every stage.
- Compare similar periods: a normal week with a normal week, not a sale week with a quiet one.
- Split by device and source: the mobile funnel usually differs from desktop, and ad traffic behaves differently from direct visits.
The funnel and your ads: a direct link
Every funnel improvement lowers your ad cost per order without touching the campaign. Raise conversion rate from 1.8% to 2% and the same budget brings about 11% more orders. So before raising ad spend, make sure the funnel isn’t wasting the visits you pay for. Work out the effect of any change on your budget with our ad budget calculator, and diagnose what happens before the click with our CPM, CPC and CTR calculator.
Key takeaways
- Conversion rate is the product of stage rates, and the funnel shows where customers leak out.
- Each rate is calculated from the previous stage, not from total sessions.
- One point on the weakest stage usually brings the biggest increase in orders.
- Each stage has its own causes: landing, product page, cart and checkout.
- Improve one or two stages at a time and measure the effect before moving on.
Frequently asked questions
What’s a normal conversion rate for an online store?
It varies widely by niche, price point, traffic source and device. It’s better to compare your store with itself over time, and to compare channels against each other within your store.
How often should I analyse the funnel?
A monthly review suits most stores, plus an extra one after any major change: a redesign, a new payment method or a big campaign.
Should I fix every stage at once?
It’s better to focus on one or two stages at a time so you can see the effect of each change. Changing everything at once makes it impossible to know what worked.
More orders don’t always need more traffic — sometimes they just need the leak plugged in the right place. Map your store’s funnel now with our free conversion funnel calculator — and if you want your store reviewed and your product and checkout pages improved, get in touch.